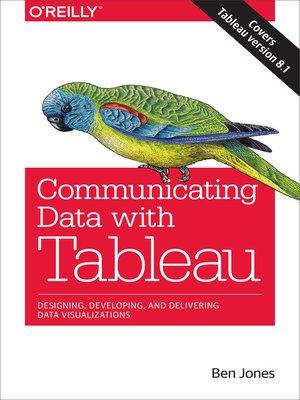
Communicating Data with Tableau
ebook ∣ Designing, Developing, and Delivering Data Visualizations
By Ben Jones

Sign up to save your library
With an OverDrive account, you can save your favorite libraries for at-a-glance information about availability. Find out more about OverDrive accounts.
Find this title in Libby, the library reading app by OverDrive.


Search for a digital library with this title
Title found at these libraries:
| Library Name | Distance |
|---|---|
| Loading... |
Go beyond spreadsheets and tables and design a data presentation that really makes an impact. This practical guide shows you how to use Tableau Software to convert raw data into compelling data visualizations that provide insight or allow viewers to explore the data for themselves.
Ideal for analysts, engineers, marketers, journalists, and researchers, this book describes the principles of communicating data and takes you on an in-depth tour of common visualization methods. You'll learn how to craft articulate and creative data visualizations with Tableau Desktop 8.1 and Tableau Public 8.1.


