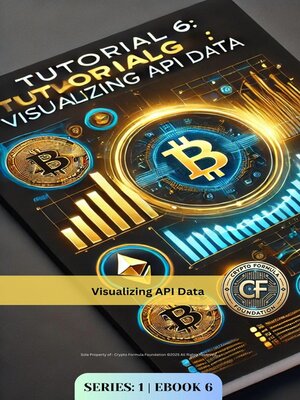
Visualizing API Data
ebook ∣ Hands‑On Tutorial for Developers and Analysts · Crypto-Series-1
By Adaptive Publishing Group

Sign up to save your library
With an OverDrive account, you can save your favorite libraries for at-a-glance information about availability. Find out more about OverDrive accounts.
Find this title in Libby, the library reading app by OverDrive.


Search for a digital library with this title
Title found at these libraries:
| Library Name | Distance |
|---|---|
| Loading... |
Data is only as valuable as the insights you can extract. In Visualizing API Data, Steven Paul provides a step‑by‑step tutorial on transforming raw JSON and CSV API responses into compelling visualizations using Python's matplotlib and JavaScript's D3.js.
• Parse and clean API data streams for charting.
• Create line, bar, and network graphs with code examples.
• Build interactive dashboards that update in real time.
Complete exercises and sample datasets guide developers, data analysts, and technical students through every stage of the visualization pipeline.


