Sign up to save your library
With an OverDrive account, you can save your favorite libraries for at-a-glance information about availability. Find out more about OverDrive accounts.
Find this title in Libby, the library reading app by OverDrive.


Search for a digital library with this title
Title found at these libraries:
| Library Name | Distance |
|---|---|
| Loading... |
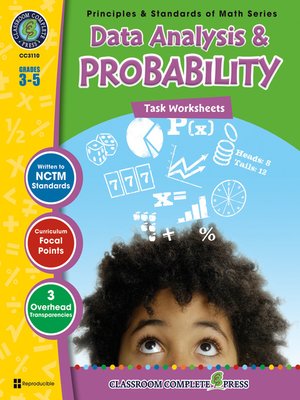
Convert information gathered into a visual graph and know how to read it. Our resource provides task and word problems surrounding real-life scenarios. Find out how many balloons are green by reading a bar graph. Sort shapes into 3 different categories. Create circle graphs to match the fractions. Survey your class to find out what pizza they like best. Find out what ride was used the least with a pictograph. Create a bar graph using information provided in a chart. Find the probability of rolling an even number on a standard die. Convert information gathered in a chart to probability statistics. The task sheets provide a leveled approach to learning, starting with grade 3 and increasing in difficulty to grade 5. Aligned to your State Standards and meeting the concepts addressed by the NCTM standards, reproducible task sheets, drill sheets, review and answer key are included.


