Sign up to save your library
With an OverDrive account, you can save your favorite libraries for at-a-glance information about availability. Find out more about OverDrive accounts.
Find this title in Libby, the library reading app by OverDrive.


Search for a digital library with this title
Title found at these libraries:
| Library Name | Distance |
|---|---|
| Loading... |
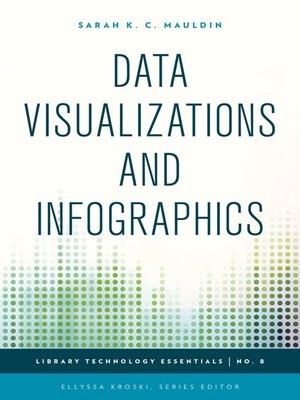
Graphics which visually represent data or complex ideas are oftentimes easier for people to understand and digest than standalone statistics. A map shaded with different colors to represent religious affiliations or income levels enables researchers to quickly identify trends and patterns. New free tools and applications offer librarians the opportunity to organize and manipulate data to quickly create these helpful graphics. Learn how to overlay data sets on maps, create infographics for library services and instruction, use mindmapping for group brainstorming sessions, produce detailed timelines, process flowcharts, diagrams, and much more in this complete how-to-guidebook.
This complete how-to guidebook provides you with the tools and inspiration you need to use infographics and data visualization techniques in your library to knock your audience's socks off as you tell your story in a visual format that can be consumed and understood at a glance.
You will learn how to:
use the tools you already have to create a simple infographic; create a library services infographic using Piktochart; create instructional infographics with Easel.ly; create interactive timelines; mindmap your brainstorming meetings; create library flowcharts and diagrams using Creately; create interactive maps with imported data; and create complex data visualizations.
This complete how-to guidebook provides you with the tools and inspiration you need to use infographics and data visualization techniques in your library to knock your audience's socks off as you tell your story in a visual format that can be consumed and understood at a glance.
You will learn how to:


